Wednesday, March 17, 2010

Final Project: Analysis of Shrink-Swell in Soils within Alameda County, CA

Soil and its properties are literally the foundation of much of our civilization. Often, soil is taken for granted in terms of its importance due to the shift towards urbanized lifestyles from the agricultural history of our past. Soil properties are used by assessors to determine taxes and land prices, determine crop yields and management, as well as conclude which land is best for building upon. Within the urban environment, the latter is often considered the most important characteristic that soil has to offer. This increased drive to build has set high demands on certain soils those of which have never been well suited for such pursuits. Various factors must be considered when pursuing a prospective site to build upon. Factors such as depth to water table and to bedrock, slope, strength of soil, soil structure and shrink-swell potential are rated and estimated in terms of cost, hazard potential and suitability. This report will focus on one major building concern—shrink-swell potential—within the San Francisco Bay Area and in particular the East Bay (USDA 1981).

Shrink-swell potential is the phenomenon of soil flexing based on moisture levels within a given soil. Types and quantities of clay within a soil contribute to its expansion and contraction. The clay properties of the soil contract or shrink when the soils’ water content is low and expand or swell when the soils’ water content is high. These inconsistencies within moisture levels of soil can lead to serious damage to buildings, as noted by the British Geological Survey:

“Shrinking and swelling of the ground (often reported as subsidence) is one of the most damaging geohazards in Britain today, costing the economy an estimated £3 billion [$4.6 billion USD] over the past decade” (2010).

Shrink-swell is of particular importance to home buyers, who are often undereducated on the topic. Because damage can consist of cracked walls and even foundations, costs for repairs can be exorbitant. General quotes for repairing a crack in a foundation can run between $500 and $800, while a complete foundation overhaul can run between $8,000 and $14,000 and for more extreme cases $30,000 (Foundation Repair Network 2010). These costs are easily avoided by choosing properties based on which soils have less shrink-swell potential than others. Homes with shallower foundations tend to be more susceptible to shrink-swell damage while deeper foundations can find more stability near the stronger bedrock. There are also preventative building techniques that can limit the amount of shrink-swell though never completely eliminate it (Wiltshier 2004).

Checking for and eliminating leaking water around the home that could periodically moisten the soil is important for reducing shrink-swell cycles. Intermittent irrigation around yards and walls of the structure should be avoided. Ways of controlling the water content through preventative methods can also curb potential damage. Installing an underground impermeable skirt can keep water from penetrating directly below the structures’ foundation. A common practice of paving the surrounding perimeter of the home or structure works very similar to the impermeable skirt just above ground (Wiltshier 2004).

Tree roots have also been a noted problem in encouraging shrink-swell potential. Since trees need moisture they pose problems if they are located near the foundation of a structure where there is potential for shrink-swell. A recommended distance to propagate trees is two times the distance of the tree’s height from the structure’s base. This allows for the trees to intake moisture without interfering with the moisture content at the structure’s foundation (Wiltshier 2004).

Taking the above factors into consideration, this paper will focus on locations in the East Bay of San Francisco Bay Area, particularly Alameda County, that have the highest potential for damage due to shrink-swell. Using GIS, I have located areas with dangerous combinations of shrink-swell susceptibility ratings. Often alluvial soils, or flood prone soils, have a high content of clay, causing more potential for shrink-swell to occur in many parts of the East Bay.

Data collection for this report includes: USDA Soil Survey GIS layer of Map Units retrieved from USDA Geopspatial Database and USDA Soil Survey (hard copy), GIS parcel map of Alameda County from Alameda County Geospatial Data Files, Bay Area city boundaries retrieved from City and County of SF, and California GIS highway and roads from Ca.gov GIS Cal-Atlas Geospatial Clearing House.


In order to limit the scope of the map, many layers have been clipped. The soil map units layer was provided by the USDA’s Geospatial Database with its foundations based with the Natural Resources Conservation Service who also had provided a complimentary hard copy of the Soil Survey of Alameda County, California, Western Part which explains the soil map units are considered to be “unique natural landscape[s]”. These units indicate the soil’s characteristics and capabilities. Through these descriptions, I created an excel table based on shrink-swell potential and joined it to the soil map units layer. I then reclassified the data as follows: low, low moderate, moderate, moderate high and high potential of shrink-swell. See Shrink-Swell Class map.


In order to show the most damage prone parcels of land within the East Bay, I analyzed land parcels that shared a mix of highest and lowest potential for shrink-swell to take place. See Parcel Intersection Map. With a portion of these parcels of land having a very stable foundation and with the adjacent portion being prone to great swelling and shrinking, there is a higher potential for foundations to become cracked and damaged. This shrinking and swelling is most problematic when the soil is distributed in an inconsistent manor such as in the “hazard prone parcels” map. By using the reclassified soil map units I was able to use the “selection by location” option within ArcMap to clip the highest and lowest potential layers out. With these layers I could then locate which parcels were along each of their boundaries and then ultimately to locate which parcels were shared by both of these extremities.


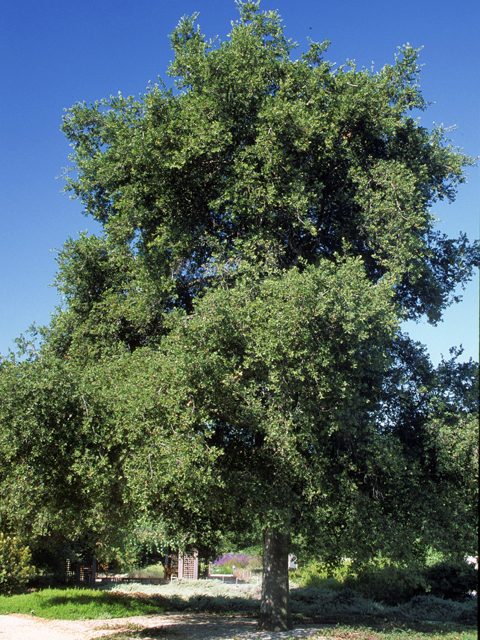
Next, since trees planted in shrink-swell areas can amplify the instability in high shrink-swell potential soils, as mentioned earlier, I analyzed areas of suitability for trees. A common tree within the Bay Area is the California Live Oak. By taking twice the Live Oaks’ average height of 80 feet, a safe planting distance from the foundation of the structure that has no root protection can be found. I then buffered the appropriate distance in which they should be planted in order to avoid exacerbating the shrink-swell problem of these soil. This knowledge of property planning can be extremely valuable when considering the potential cost in repairs and damages that can accrue from lack of action (Howell 1986).


The University of Texas at Austin: Lady Bird Johnson Wildflower Center

These maps help to illustrate the inconsistencies of shrink-swell potential within the Alameda County region, areas that can be at great risk for damage to building foundations. Significant trends appear within the maps that give the viewer insight into soil types and suitable planning areas. The waterfront locations through Emeryville and Oakland show extended shared boundaries of extreme high and low risk for shrink-swell potential and would ultimately cost more to build upon. Preventative methods such as using building pads to help drain water from the foundation of a structure would potentially have to be implemented in order to start construction.

Soil properties present various complexities in terms of building limitations. However, limitations to building limitations as a whole are far more expansive than what is explored within this report. Issues such as liquefaction, inundation, etc. also need to be considered before construction. This report focuses on only one important factor—shrink-swell potential—which is considerably wide spread in the East Bay. Possibilities of other dangerous combinations of shrink-swell can occur, which could also spell disaster for homes throughout these areas if proper building techniques are not taken into account ahead of time, though this report illustrates the most extreme combination of high and low risk of shrink-swell potential. Parcels completely within the high shrink-swell risk areas are prone to high damage as well, though the uniformity within those soils could lead to lesser damage. Damage report data from the problem areas would be valuable in order to confirm the ideas shown in the maps. Though determining whether cracks in walls or foundations were caused by shrink-swell versus another factor is difficult. As Wiltshier indicates,

“There are many other potential causes of cracking to masonry buildings including:
• Consolidation of poorly compacted soils (either natural soils or fill) when loaded with the weight of a building;
• Vibration causing consolidation of soils (eg traffic, construction activities,
earthquake, mining blasting);
• Mine subsidence due to underground tunneling;
• Wash out or softening of the ground below the footings due to saturation by
• Subsurface flow (e.g. stormwater or broken service pipes);
• Corrosion of lintels or embedded steelwork or decay of embedded timber within walls;
• Earthquake or wind loads;
• Deterioration of materials (e.g. failing rubble walls)” (2004).

Unfortunately, these factors complicate the access to data based around this phenomenon. Regardless of this fact, shrink-swell is a serious problem of clay based soils and should certainly be considered when purchasing a home or business especially within these mapped areas.


Bibliography

Alameda County: County Geospatial Data Files. Alameda Parcel (GIS shapefile). <http://www.acgov.org/gis.htm> data retrieved 3/10/10.

British Geological Survey: Natural Environment Research Council. Ground Shrinkage and Subsidence. <http://www.bgs.ac.uk/science/landUseAndDevelopment/shallow_geohazards/shrinking_and_swelling_clays.html> retrieved 3/10/10.

City and County of San Francisco: SFGIS Data Catalog. Bay Area Cities (GIS shapefile). <http://gispub02.sfgov.org/website/sfshare/index2.asp> data retrieved 3/10/10.

Foundation Repair Network. Average Foundation Repair Costs and Variables. 2010. <http://www.foundationrepairnetwork.com/cost.html> retrieved 3/12/10.

Howell, J.T. Quercus acroglandis Kellogg; Q. agrifolia var. oxyadenia (Torrey). Flora of North America. Volume 3. 1986. <http://www.efloras.org/florataxon.aspx?flora_id=1&taxon_id=233501005> retrieved 3/15/10.

State of California: Cal-Atlas Geospatial Clearing House. California Highway (GIS shapefile). <http://atlas.ca.gov/download.html> data retrieved 3/10/10.

State of California: Cal-Atlas Geospatial Clearing House. California Local Roads (GIS shapefile). <http://atlas.ca.gov/download.html> data retrieved 3/10/10.

United State Department of Agriculture (USDA): Geospatial Database. Soil Survey, Alameda County(GIS shapefile) <http://datagateway.nrcs.usda.gov/OrderStatus.asp?OrderID=1161564> data retrieved 3/10/10.

The University of Texas at Austin: Lady Bird Johnson Wildflower Center. <http://www.wildflower.org/image_archive/640x480/SAW/SAW_02976.JPG> image retrieved 3/15/10.

Wiltshier, Simon. Cracking of Buildings due to Shrink/Swell in Clay Soils. Technical Advisory Group (TAG) of the Heritage Council of NSW. May 2004. <http://www.heritage.nsw.gov.au/docs/TAG_cracking.pdf> retrieved 3/09/10.

Tuesday, March 16, 2010

Quiz 2

1. Rank order the ten most populous countries of the world.


China
India
USA
Indonesia
Russia
Brazil
Pakistan
Japan
Bangladesh
Nigera

2. Identify the three most populous countries in Africa.


Nigeria
Guinea
Egypt

3. Rank order the five countries of South America with the lowest population.


French Guiana
Suriname
Guyana
Uruguay
Paraguay


4. The Amazon river system consists of how many rivers?


8 Rivers

5. What cities are within 500km of the Amu Darya and Syr Darya rivers?


More cities on next screenshot...


6. To the nearest 100,000 what is the total population of countries within 300 kilometers of Iran (not including Iran)?

Based on "have their centroid within" 300k buffer around Iran:
44,400,000


7. Identify the most and least populous countries of the landlocked countries of the world.


Least populous landlocked country is Vatican City.


Most populous landlocked country is Ethiopia.

8. Identify the all countries within 300 kilometers of Veszprem, Hungary.


Based on "have their centroid within" 300k buffer around Veszprem, Hungary:
Slovenia
Croatia
Slovakia
Austria
Hungry

Thursday, March 4, 2010

Lab #7: Spatial Interpolation


My spatial interpolation maps of rainfall throughout Los Angeles county are quite revealing and fascinating. The current rainfall pattern indicates a trend of even and continuous distribution of

rainfall throughout LA county with a few exceptions. The maps showing differences between the current seasonal total and normal seasonal rainfall illustrate the discrepancies between the two effectively. These difference maps show a large discrepancy in rainfall totals within the Angeles National Forest region. This hot spot shows a significant shortage of rainfall where most other areas are only slightly below or above normal seasonal totals. These numbers can be understood within the scope of our current seasonal rainfall sample.

By understanding the current seasonal rainfall totals, we are able to determine important contexts behind the map. As the Department of Public Works Real-Time Precipitation map indicates, "Accumulated Precipitation in Inches Beginning on 10-01-2009 and Ending on 03-04-2010", the current seasonal rainfall totals are created based on 5 months of the most significant rainfall for the Los Angeles county area. This sample date window illustrates why the difference maps show such a minor difference between the current and normal rainfall patterns. Though the exception within the center of the two difference maps is quite interesting and deserves more investigation.

I chose my two spatial interpolation techniques through considering the ideas expressed in Prof. Shin's lecture as well as within the Interpolating Surfaces reading from the website. The reading indicated the IDW technique as being useful in interpolating sample points based on their distance values. I found that this technique would be valuable in mapping rainfall data considering the nature of rainfall intensity being tied to proximity in terms of regionally similar trends. I also chose the Regularized Spline method based on the ability to generate "exact interpolation" by passing directly through the rainfall value points. I believed that passing through the rainfall accumulation values exactly would minimize the significant loss within the fine margin of variation between current and normal rainfall totals. I also felt the Splines ability to create accurate surfaces for continuous temperature phenomena would lend itself well, and ultimately more accurately than the IDW method, to the also fairly continuous phenomena of rainfall.

Tuesday, February 23, 2010

Lab #6: Fire hazard mapping

My Station Fire Hazard Map


Modeling the Wildland/Urban Interface Tutorial


The process of creating this fire map required patience and resolve. As I learned, raster spatial analysis has its own particularities and pitfalls, but with focus and help from the methods used in the tutorial there was much to be learned. The process of data acquisition required the creator to have a good understanding of the methods in which this map could be created. There were many similar shapefiles on the FRAP website that could easily trick you up if you were not paying close attention to the steps in creating this map. Knowledge of methods such as raster clipping, analysis masking and the reclassification of layers helped greatly to understand the creation of the hazard map.

This lab wonderfully illustrated the distinct differences between manipulating vector data and raster data. The differences were quite great at times and required a different mode of thinking. I found many of the processes required you to forget about the ways you knew how to manipulate data with vector and become more familiar with the unique methods surrounding raster data. At times, I had trouble confirming layer formats, cell sizes and changes in extent coverage. By working through these difficulties I was able to better understand the processes behind these techniques.

Though some of the techniques for processing raster data were difficult at times, I found that once you had a better feel for the ideas that many very valuable things could be achieved with it. Through gaining a better understanding for these tools, I found methods that could save myself time and prevent mistakes. Though, one problem I found, was that given the different data, and even terminology at times, between the tutorial and within my own map, I found it rather difficult to put together particular methods for solving certain problems. By taking a closer look at the methods within the tutorial, steps with little explanation in the tutorial began to reveal their true intentions. Also, hazard maps are just one small portion of the potential that raster data manipulation can offer. For this reason I am very excited to work more with raster data in order to better understand these valuable skills.

Tuesday, February 16, 2010

Lab #5: Spatial Analysis I - Suitability Analysis

Suitability Analysis with Raster Data-Part 1


Suitability Analysis with Raster Data-Part 2


Controversies surrounding the Landfill project based around the Kettleman City area can be clarified through research and GIS techniques. Various topics ranging from safe work practices, polluting materials, proximity of the site to the city and origins of the birth defects within town, illustrate how complicated an issue like this can become. The facility is currently located there but is looking to make a major expansion and local citizens are not comfortable with this prospect without the proper research and testing being completed to ensure the safety of their towns. GIS is a valuable tool in deciphering what are safe and fair decisions for the questions surrounding topics such as these.

One of the foundational complaints about the expansion is the lack of investigation that has taken place. Kettleman City residents have been demanding a proper investigation into the diseases and birth defects surrounding the community. Some believe that the disease and birth defects around the city could be considered no higher than average. Other citizens believe this is ludicrous. Additional research and support from the State of California would help greatly in informing the public nearby the facility.

Unfortunately, this has not been the case. The research that has been conducted by the California Birth Defects Monitoring Program has not been fully accepted by the citizens of the towns nearby. People do not trust the foundations of the research and, in turn, do not trust the decisions of the legislators. This breakdown in trust comes from a lack of transparency within the scientific and political process. With clearer data indicating the potential causes of the health problems, contributing health problems to the landfill or otherwise, the more the public would be willing to accept the decisions of the political shot callers. This is when we see the true value of GIS.

GIS, with the assistance of quality data, can help to inform the public or legislators about what is happening within a given area based on many factors. In conjunction with quality research from other organizations, such as the EPA or the California Birth Defects Monitoring Program, GIS can tie together correlations between different phenomena allowing for greater understanding. Also, the techniques in our tutorial can help to present clear and concise findings to the public to help to earn the trust of the families suffering within the community.

The traditional methods of collecting, processing, and presenting data should be reconsidered in situations dealing with the public. Newer methods used within a GIS can help greatly in bridging the gap of trust and understanding in the process of governing. NIMBY is often a term used to derogatorily refer to people who, often selfishly, over critique the decisions made by community planners in order to sustain the status quo. Yet, in this circumstance, the community has good reason to be alarmed based on changes taking place in their community and has every right to demand answers from our community leaders. Hopefully, researchers are utilizing GIS to better inform these individuals on up-to-date and accurate research on the status of all scientific findings around their area.

Wednesday, February 3, 2010

Exam: Mapping Marijuana Dispensaries


The issues surrounding marijuana dispensaries and their impact on the neighborhoods in which they reside is longstanding. This debate often comes on the back of claims that marijuana dispensaries lead to increased crime near their proximity. Though there could be some legitimacy to this argument, statistics to back up the claim are never at the forefront of the debate. Regardless of these clashing views, an ordinance has been passed requiring dispensaries to reside at least 1,000 feet away from all LA school, libraries, and public parks.

The ordinance requiring a 1000ft buffer seems excessive. As shown on my map above, it is difficult to find a marijuana dispensary that won't have to relocate due to this new ordinance. The heavy limitations of this buffer discourages economic activity that the city of Los Angeles greatly needs today. With the news that the City of Los Angeles having huge problems paying its bills, it is surprising that the city does not choose to better incorporate these businesses that could be taxed for social benefit. Unfortunately this ordinance displays the City of Los Angeles' approach to the purported increase of crime and tasteless activities that take place around these businesses. In addition to the loss of revenue is the loss to medical patients that need the plant for pain and treatment. These patients are going to have a harder time locating a dispensary and potentially addition regulations in the future.

These limited options offered to marijuana dispensaries for locations could also effect rental and land costs. Since there will be such a limited set of locations for the dispensaries to exist, potentially this land could greatly rise in cost to these businesses. This rise in cost could potentially be passed down to the patients who budget medical expenses closely.

I believe the City of Los Angeles needs to re-think their strategy when approaching this problem and consider other options rather than forcing out a potential friend to the community.